Simulation and Analysis of Heavy Rainfall and Flash Flood Warnings for Wai‘alae
Disaster Scenario Simulation and Analysis System: The Wai‘alae, Hawai‘i Case
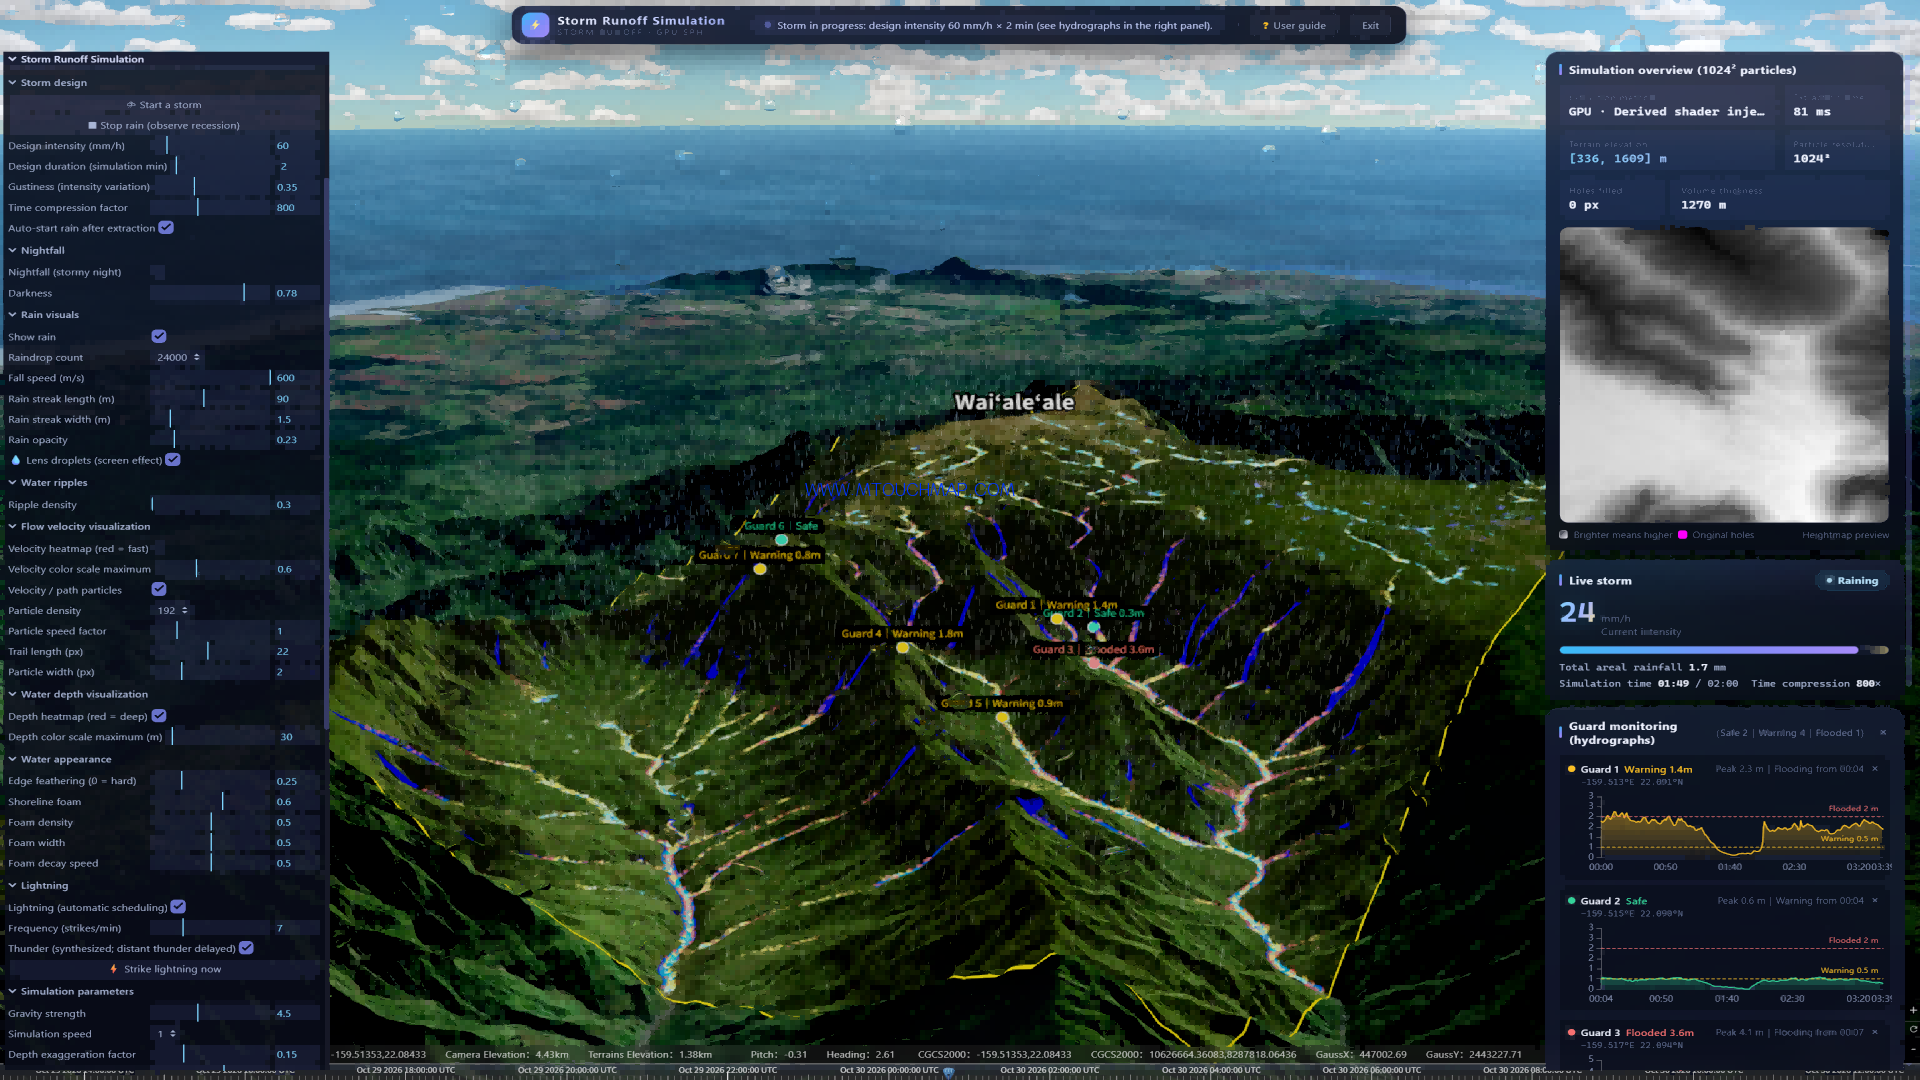
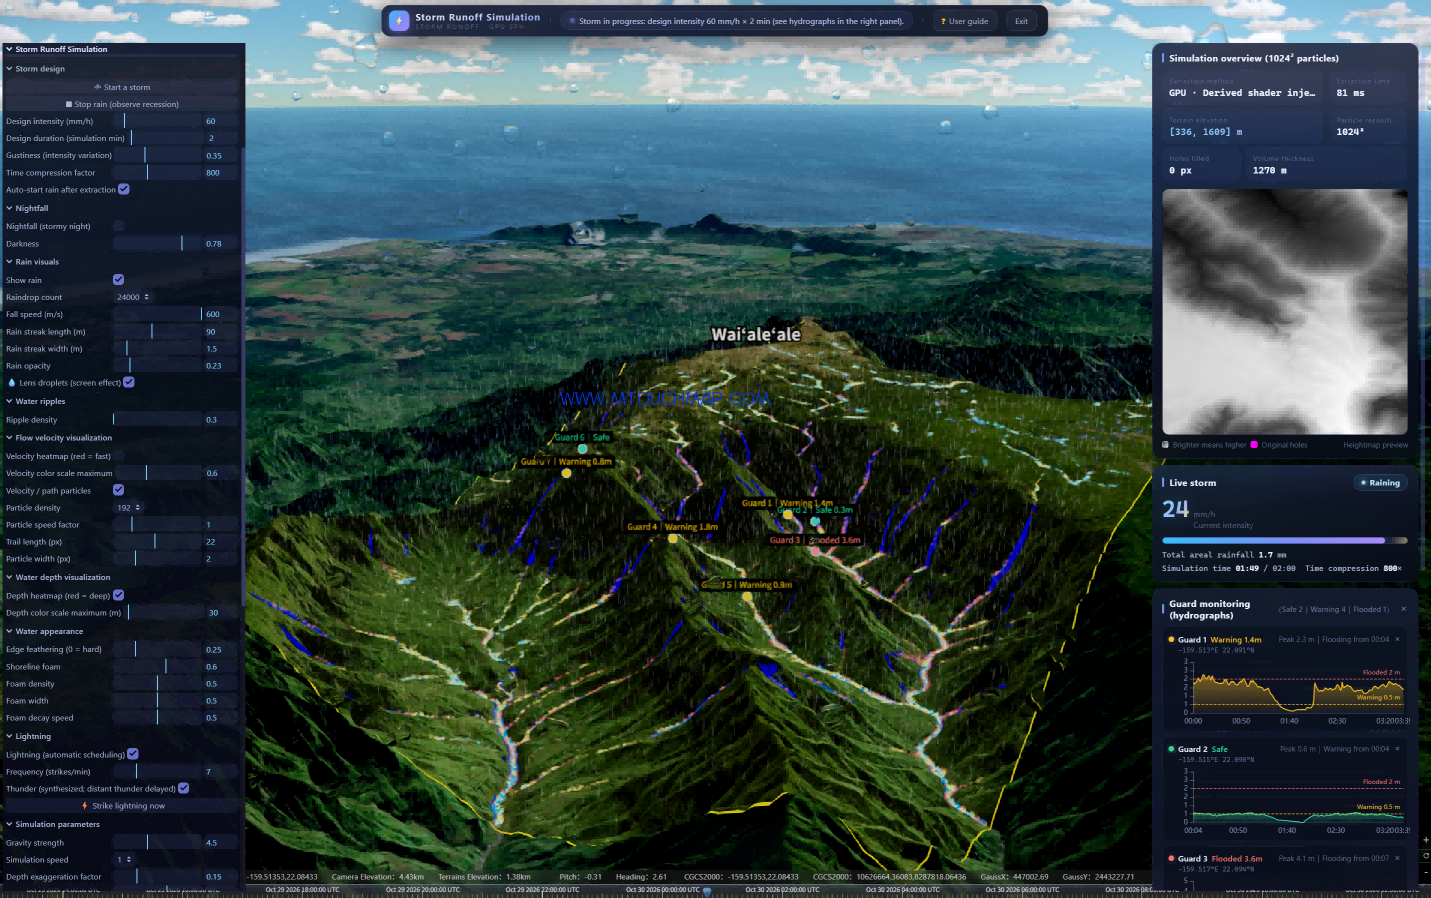
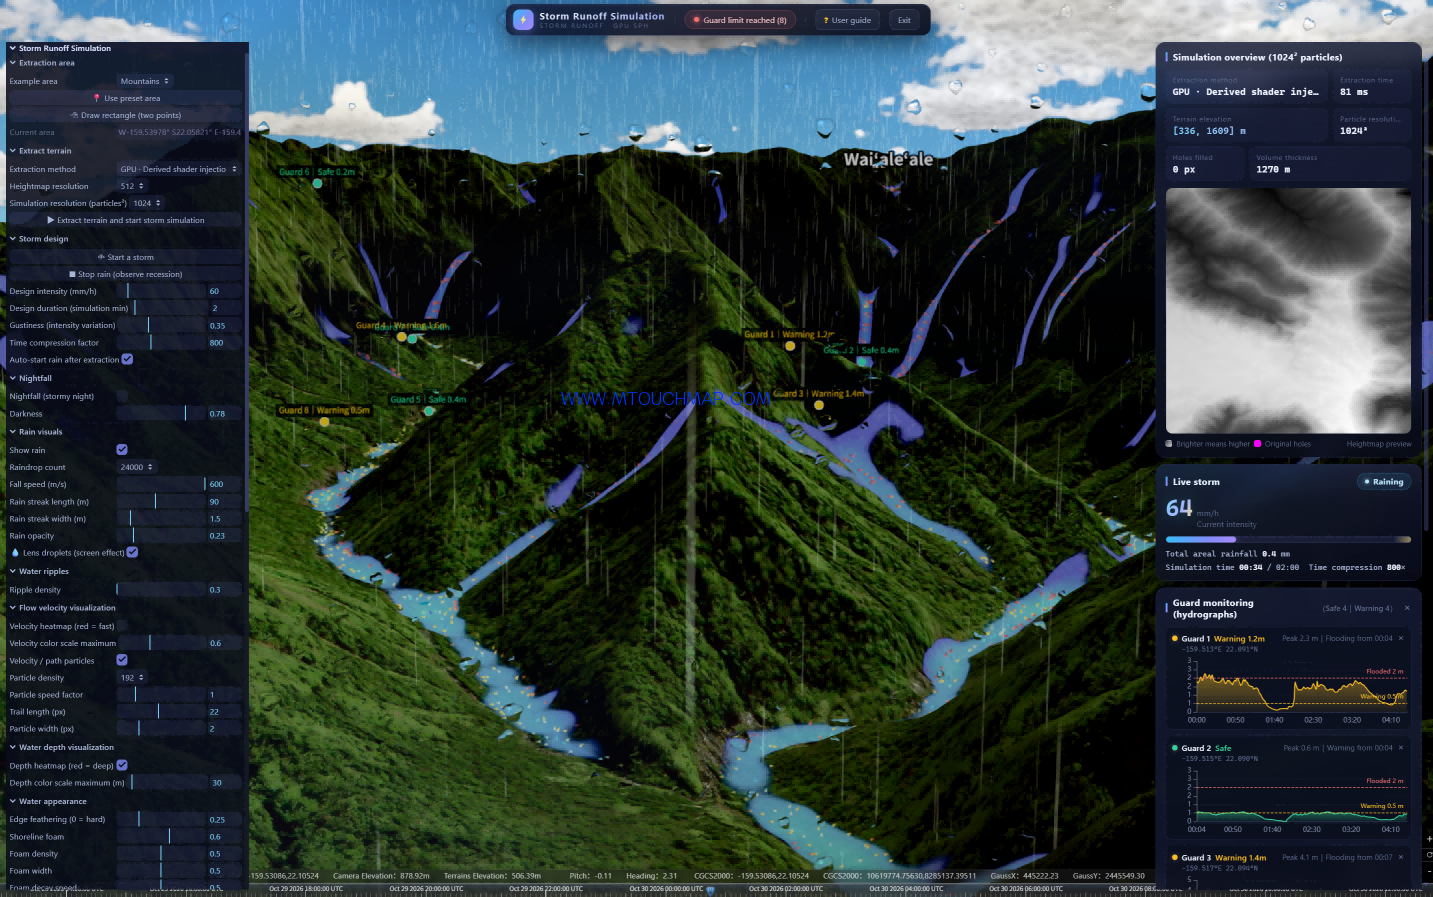
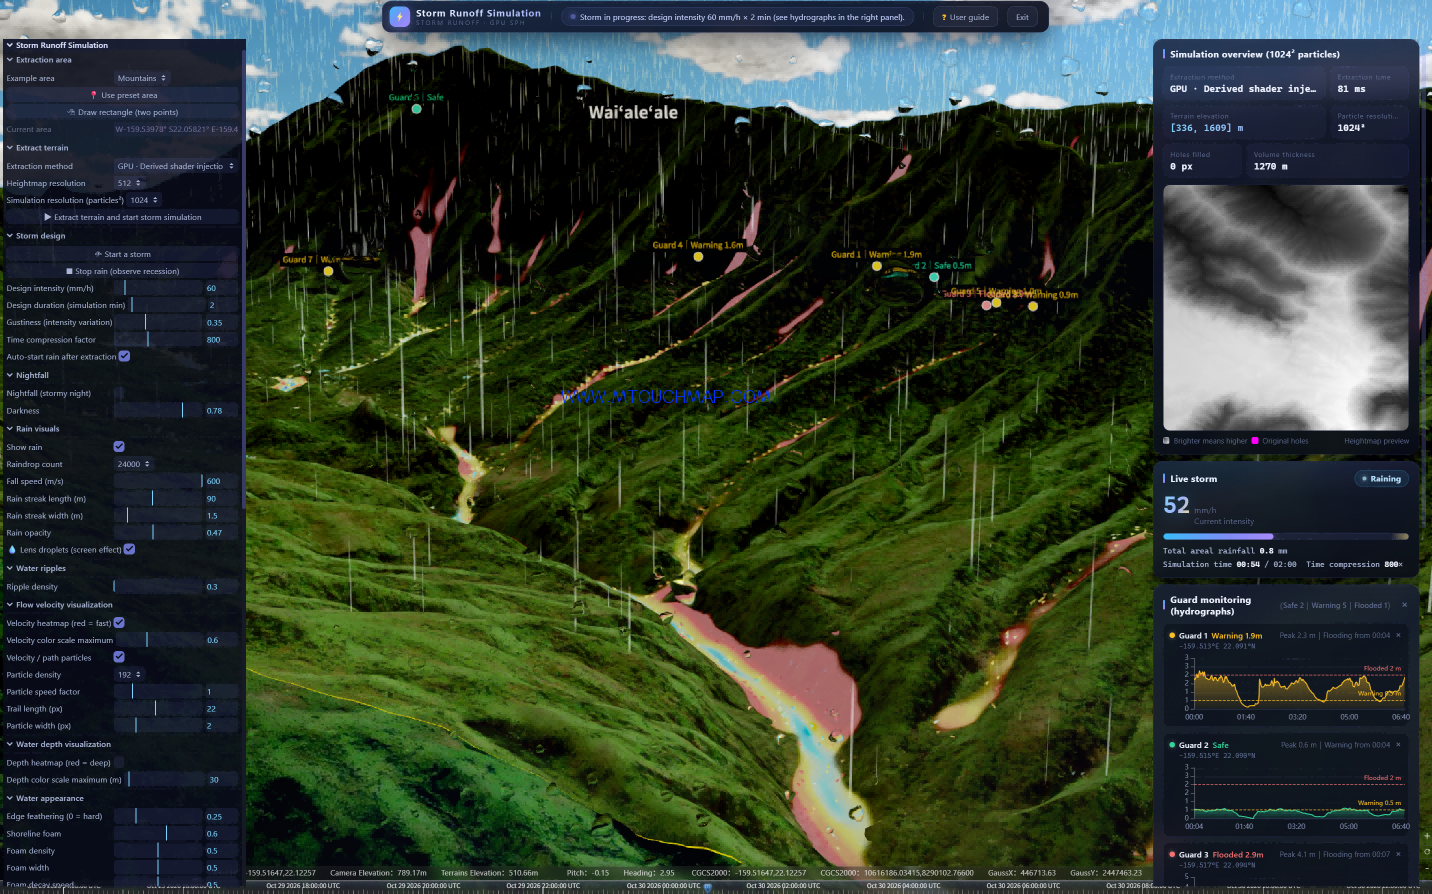
Simulation and Analysis of Heavy Rainfall and Flash Flood Warnings for Wai‘alae A Brief Overview of the Flash Flood Simulation for Mount Wai‘ale‘ale, Hawaii: This demonstration utilizes Mount Wai‘ale‘ale in Hawaii—one of the wettest places on Earth, with an elevation range of 336–1,609 meters—as the terrain base. Leveraging GPU acceleration, the system achieves data extraction and particle-based computation (at a 1024² resolution) with a processing time of just 81 milliseconds. By simulating an extreme rainfall event of 60 mm/h, the physical engine realistically models the processes of surface runoff and flow convergence across the lush, mountainous landscape. Flood peak paths are visualized through heatmaps, with colors representing flow velocity (red/yellow) and water depth (blue). Eight monitoring stations are strategically positioned to generate real-time hydrographs, capturing critical early-warning data—such as a 3.6-meter inundation depth and a 4.1-meter peak at "Guard 3"—thereby completing an end-to-end simulation, from the initial heavy rainfall scenario to site-specific flood warnings.
1. Terrain Foundation and Computational Performance
This demonstration utilizes the actual topography of Mount Wai‘ale‘ale on the island of Kaua‘i, Hawai‘i (elevation 336–1,609 meters). As one of the rainiest places on Earth—characterized by lush green slopes, deep ravines, and steep gradients—this location serves as an ideal setting to test the system’s ability to simulate runoff generation and flow accumulation during heavy rainfall in a complex tropical rainforest environment. Powered by a GPU-accelerated architecture, the system achieves terrain extraction in 81 milliseconds and fluid simulation at a resolution of 1024² particles. The terrain model covers a vertical range of 1,270 meters, fully capturing the elevation variations across the entire watershed.
2. Fully Customizable Rainfall Parameters
The system offers comprehensive customization for all rainfall elements, allowing users to define precipitation scenarios exactly as they envision. Key parameters—such as a design rainfall intensity of 60 mm/h, a 2-minute simulation duration, a 0.35-level stochastic disturbance factor, and an 800x time-compression ratio—can be configured independently. The system compresses a 2-hour extreme rainfall event into a 2-minute simulation, while simultaneously rendering high-density "rain curtains" (consisting of 24,000 individual elements) and water droplets on the virtual camera lens. Throughout the simulation, the system displays real-time data—including a current rainfall intensity of 24–64 mm/h and a cumulative rainfall of 1.7 mm—effectively recreating the intense, overwhelming atmosphere of a tropical downpour.
3. Physics-Engine-Driven Runoff and Flow Accumulation
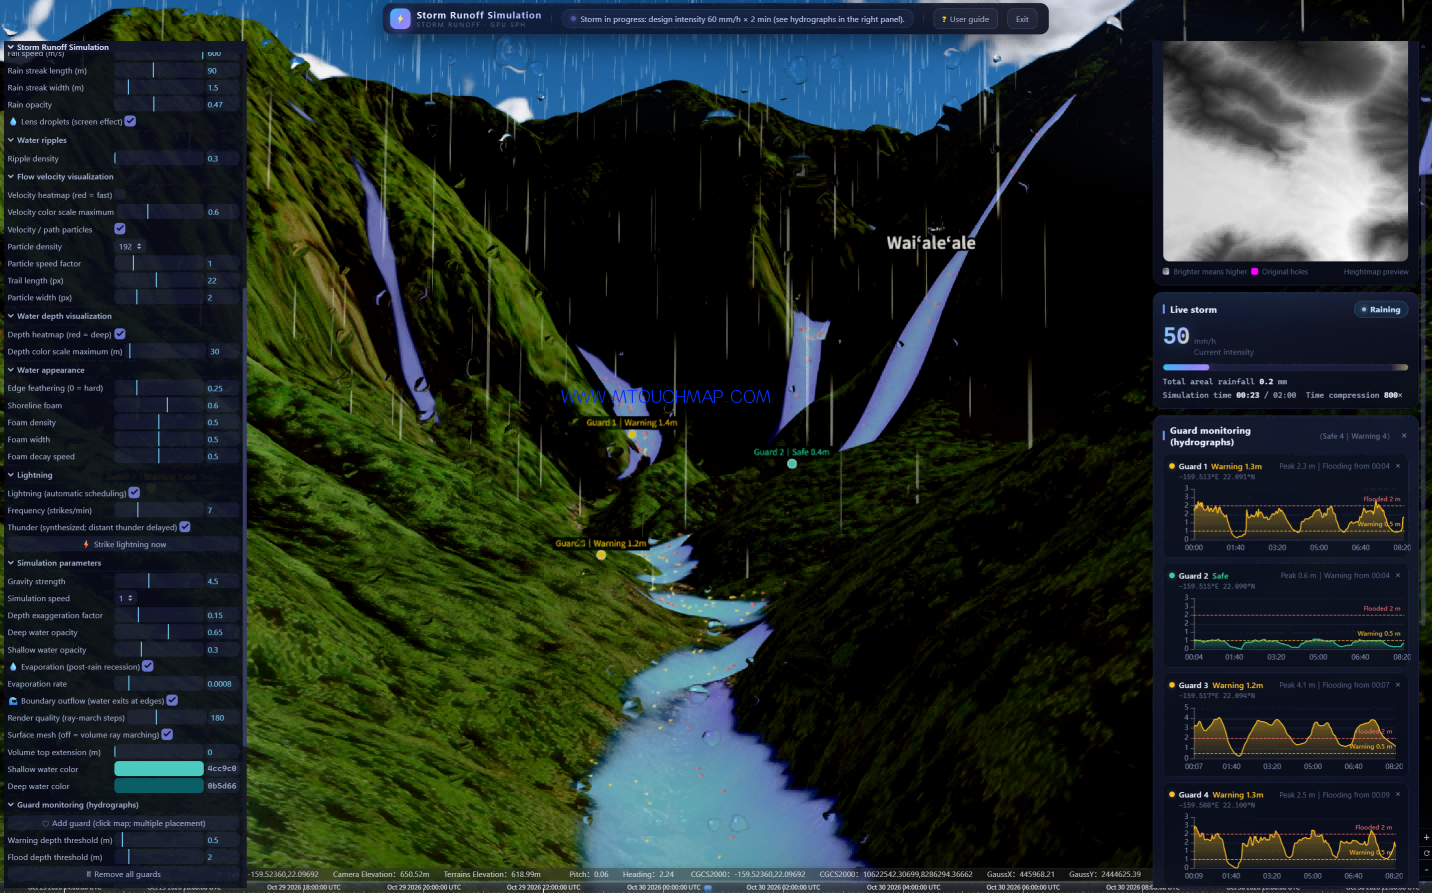
Unlike traditional methods that rely on simple texture-based inundation overlays, this system employs an SPH (Smoothed Particle Hydrodynamics) physics engine. This enables rainwater to naturally generate runoff and accumulate across the actual terrain. As raindrops fall onto the mountain ridges, they follow the natural contours of the ravines, gathering and accelerating to form flood peaks. Through a dual-visualization approach—utilizing heat maps for flow velocity (red/yellow indicating rapid flow) and water depth (blue indicating deep water)—combined with dynamic tracking via 192 high-density particle paths, the entire flood process—from formation and convergence to flow velocity and inundation depth—is rendered clearly and with high contrast against the green, mountainous terrain.
4. Site-Specific Monitoring and Early-Warning Decision Support
The ultimate goal of these simulations is early warning. Users can strategically place up to eight "guard" monitoring points at critical locations, such as valleys, roads, or confluence zones, within the 3D environment. The system automatically monitors each designated point and generates a unique hydrograph (flow/depth process line). As shown in the screenshots, "Guard 1" indicates a warning level of 1.4m (peaking at 2.3m), "Guard 3" shows an inundation depth of 3.6m (peaking at 4.1m), and "Guard 7" shows a warning level of 0.8m. These process lines provide real-time feedback on water depth and safety/warning status, while automatically recording peak depths and the timing of warning triggers—offering quantitative data to inform flood-control decision-making.
5. End-to-End Simulation and Practical Application
This demonstration showcases the complete "flash flood" lifecycle—from heavy rainfall and runoff generation to flow convergence and site-specific early warning—within a digital twin of Mount Waialeale, one of the wettest places on Earth. This capability is ideally suited for international presentations, demonstrating the system’s robust simulation performance in complex, high-relief, and densely vegetated tropical terrain. It has broad applications in flash flood early warning, watershed risk assessment, and emergency flood-response drills.