Multi-Source Confluence Early-Warning Deduction in the Grand Canyon
Disaster Situation Simulation and Deduction System: Multi-Source Confluence Early-Warning Deduction in the Grand Canyon, USA
This is not a pre-rendered animation. It is a live GPU SPH fluid simulation — real terrain, real water, and real-time warning.
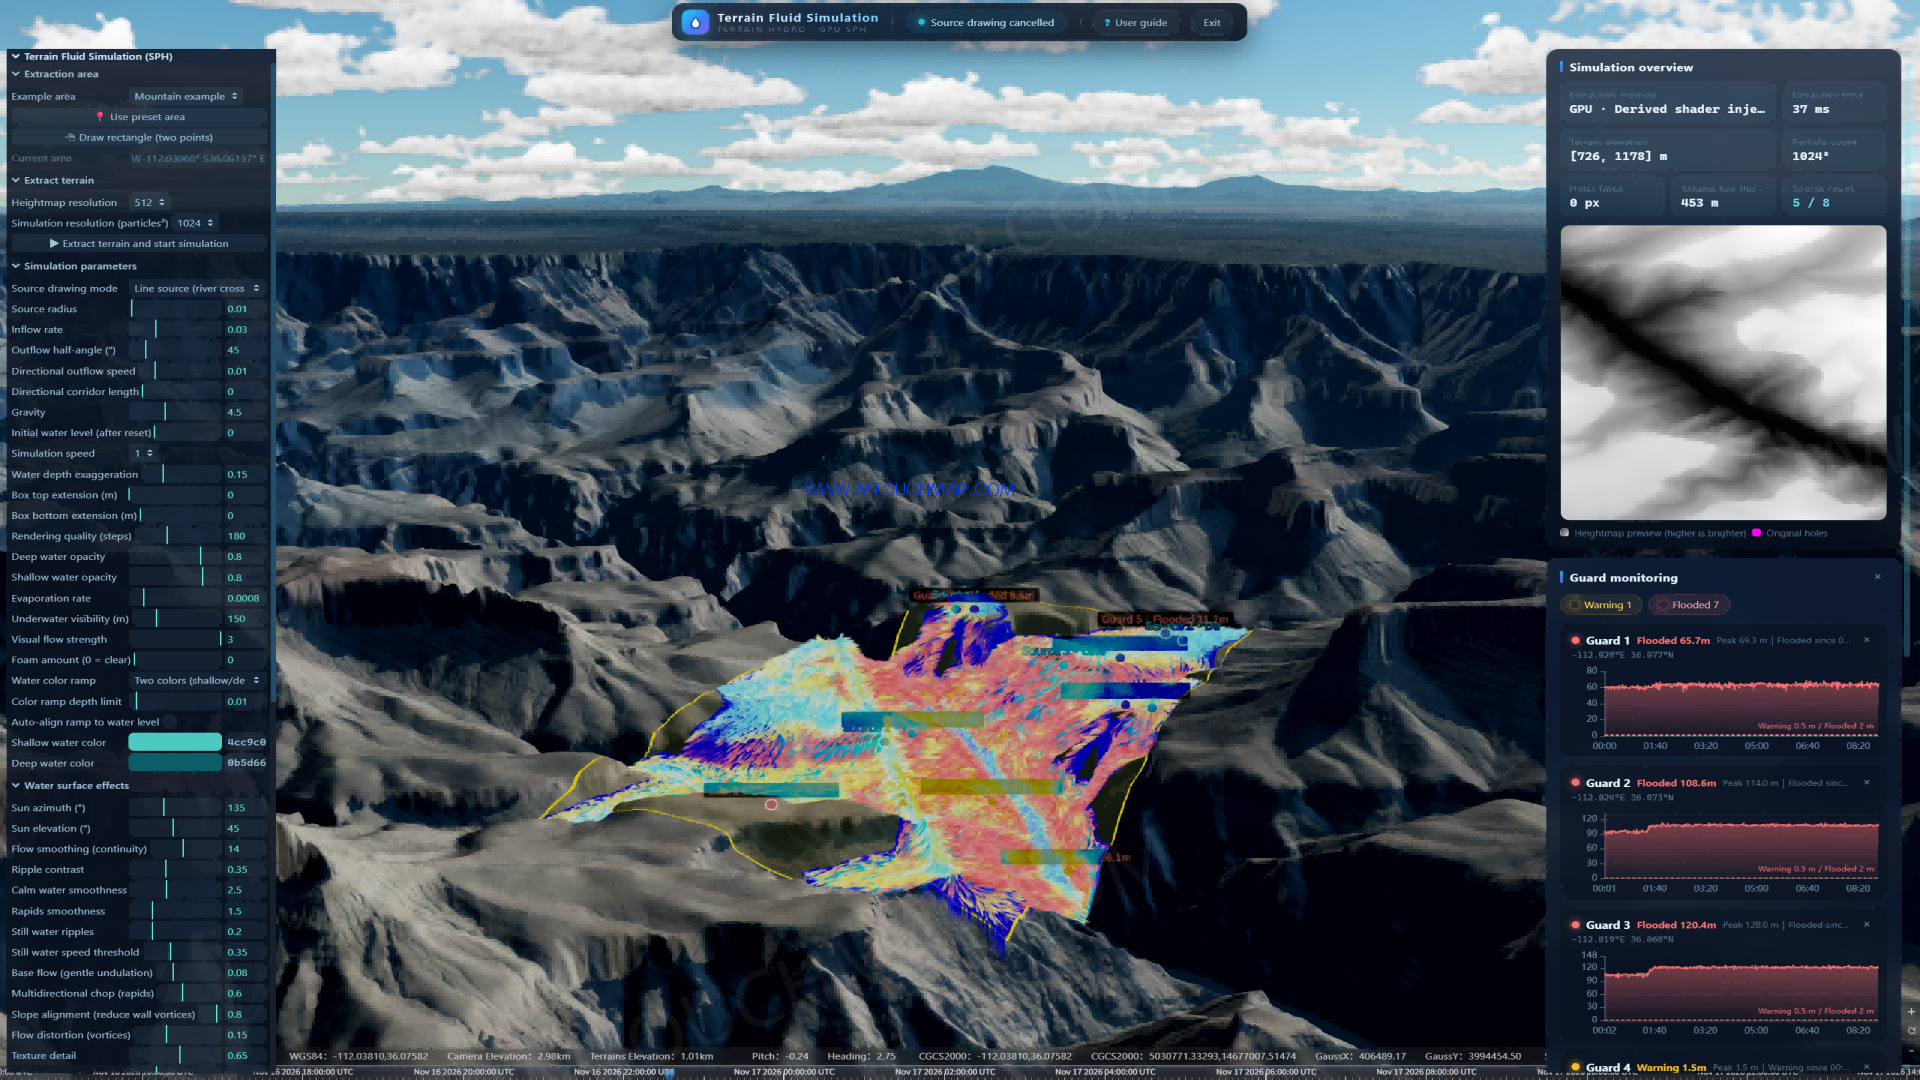
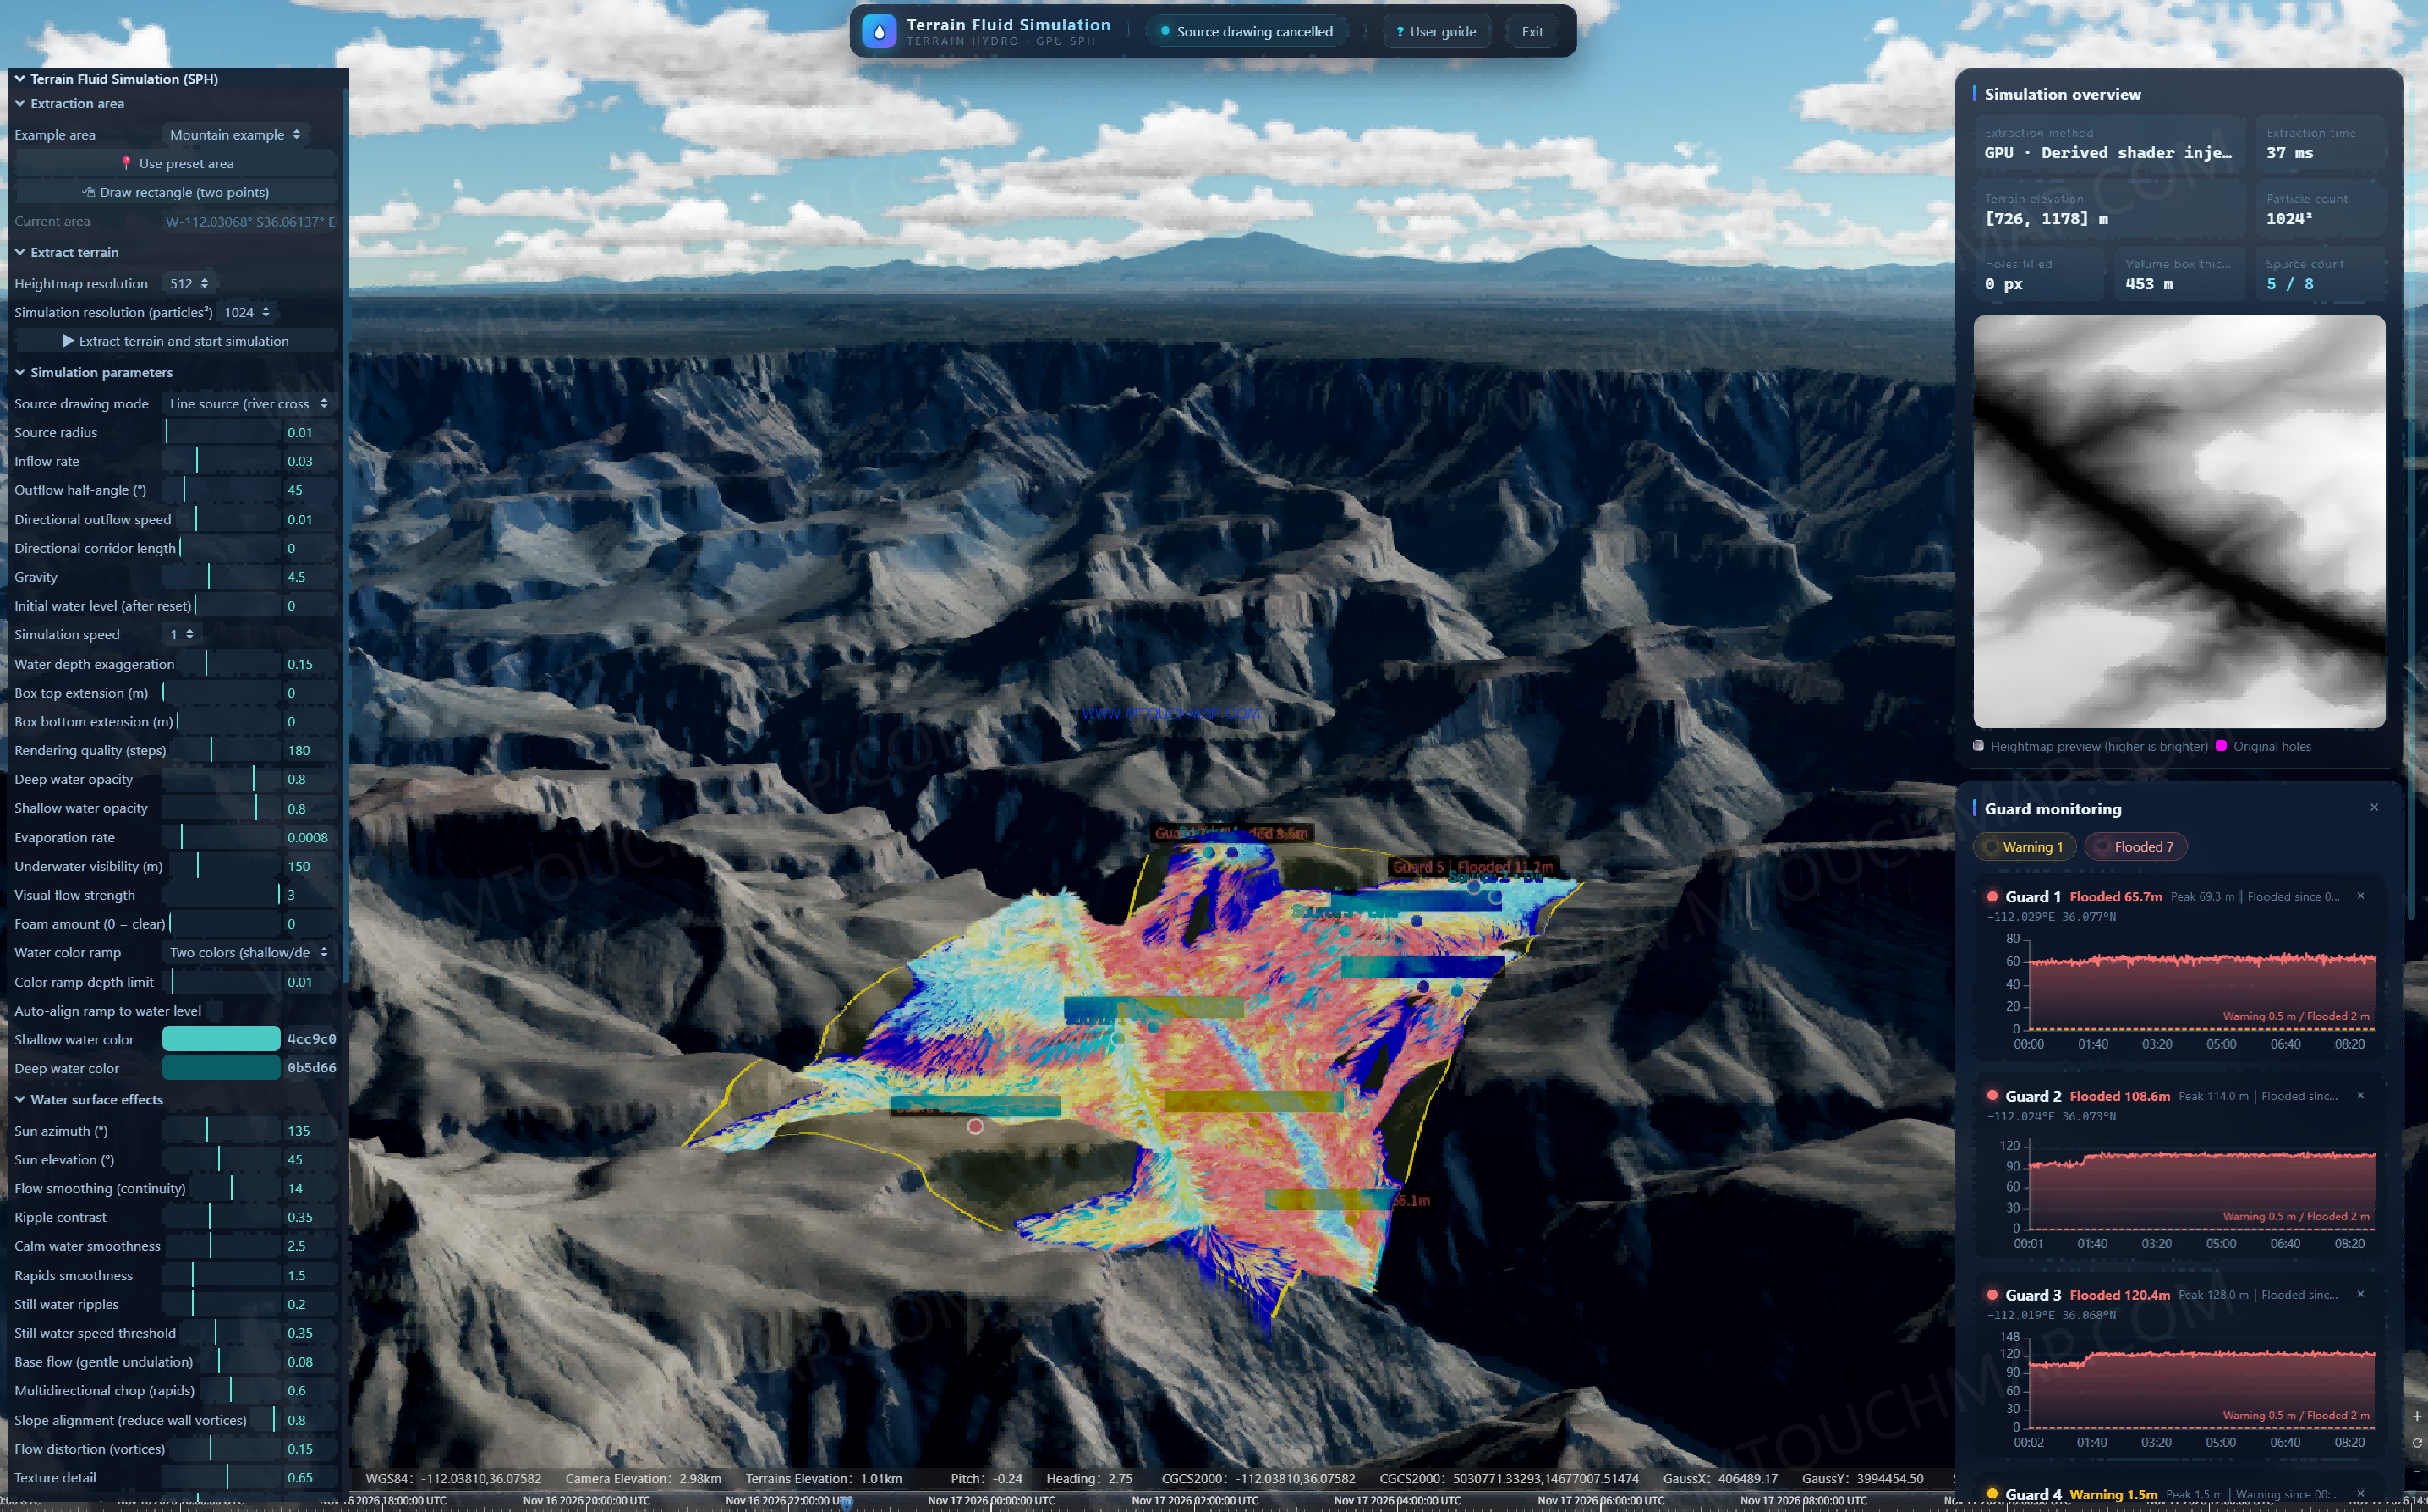
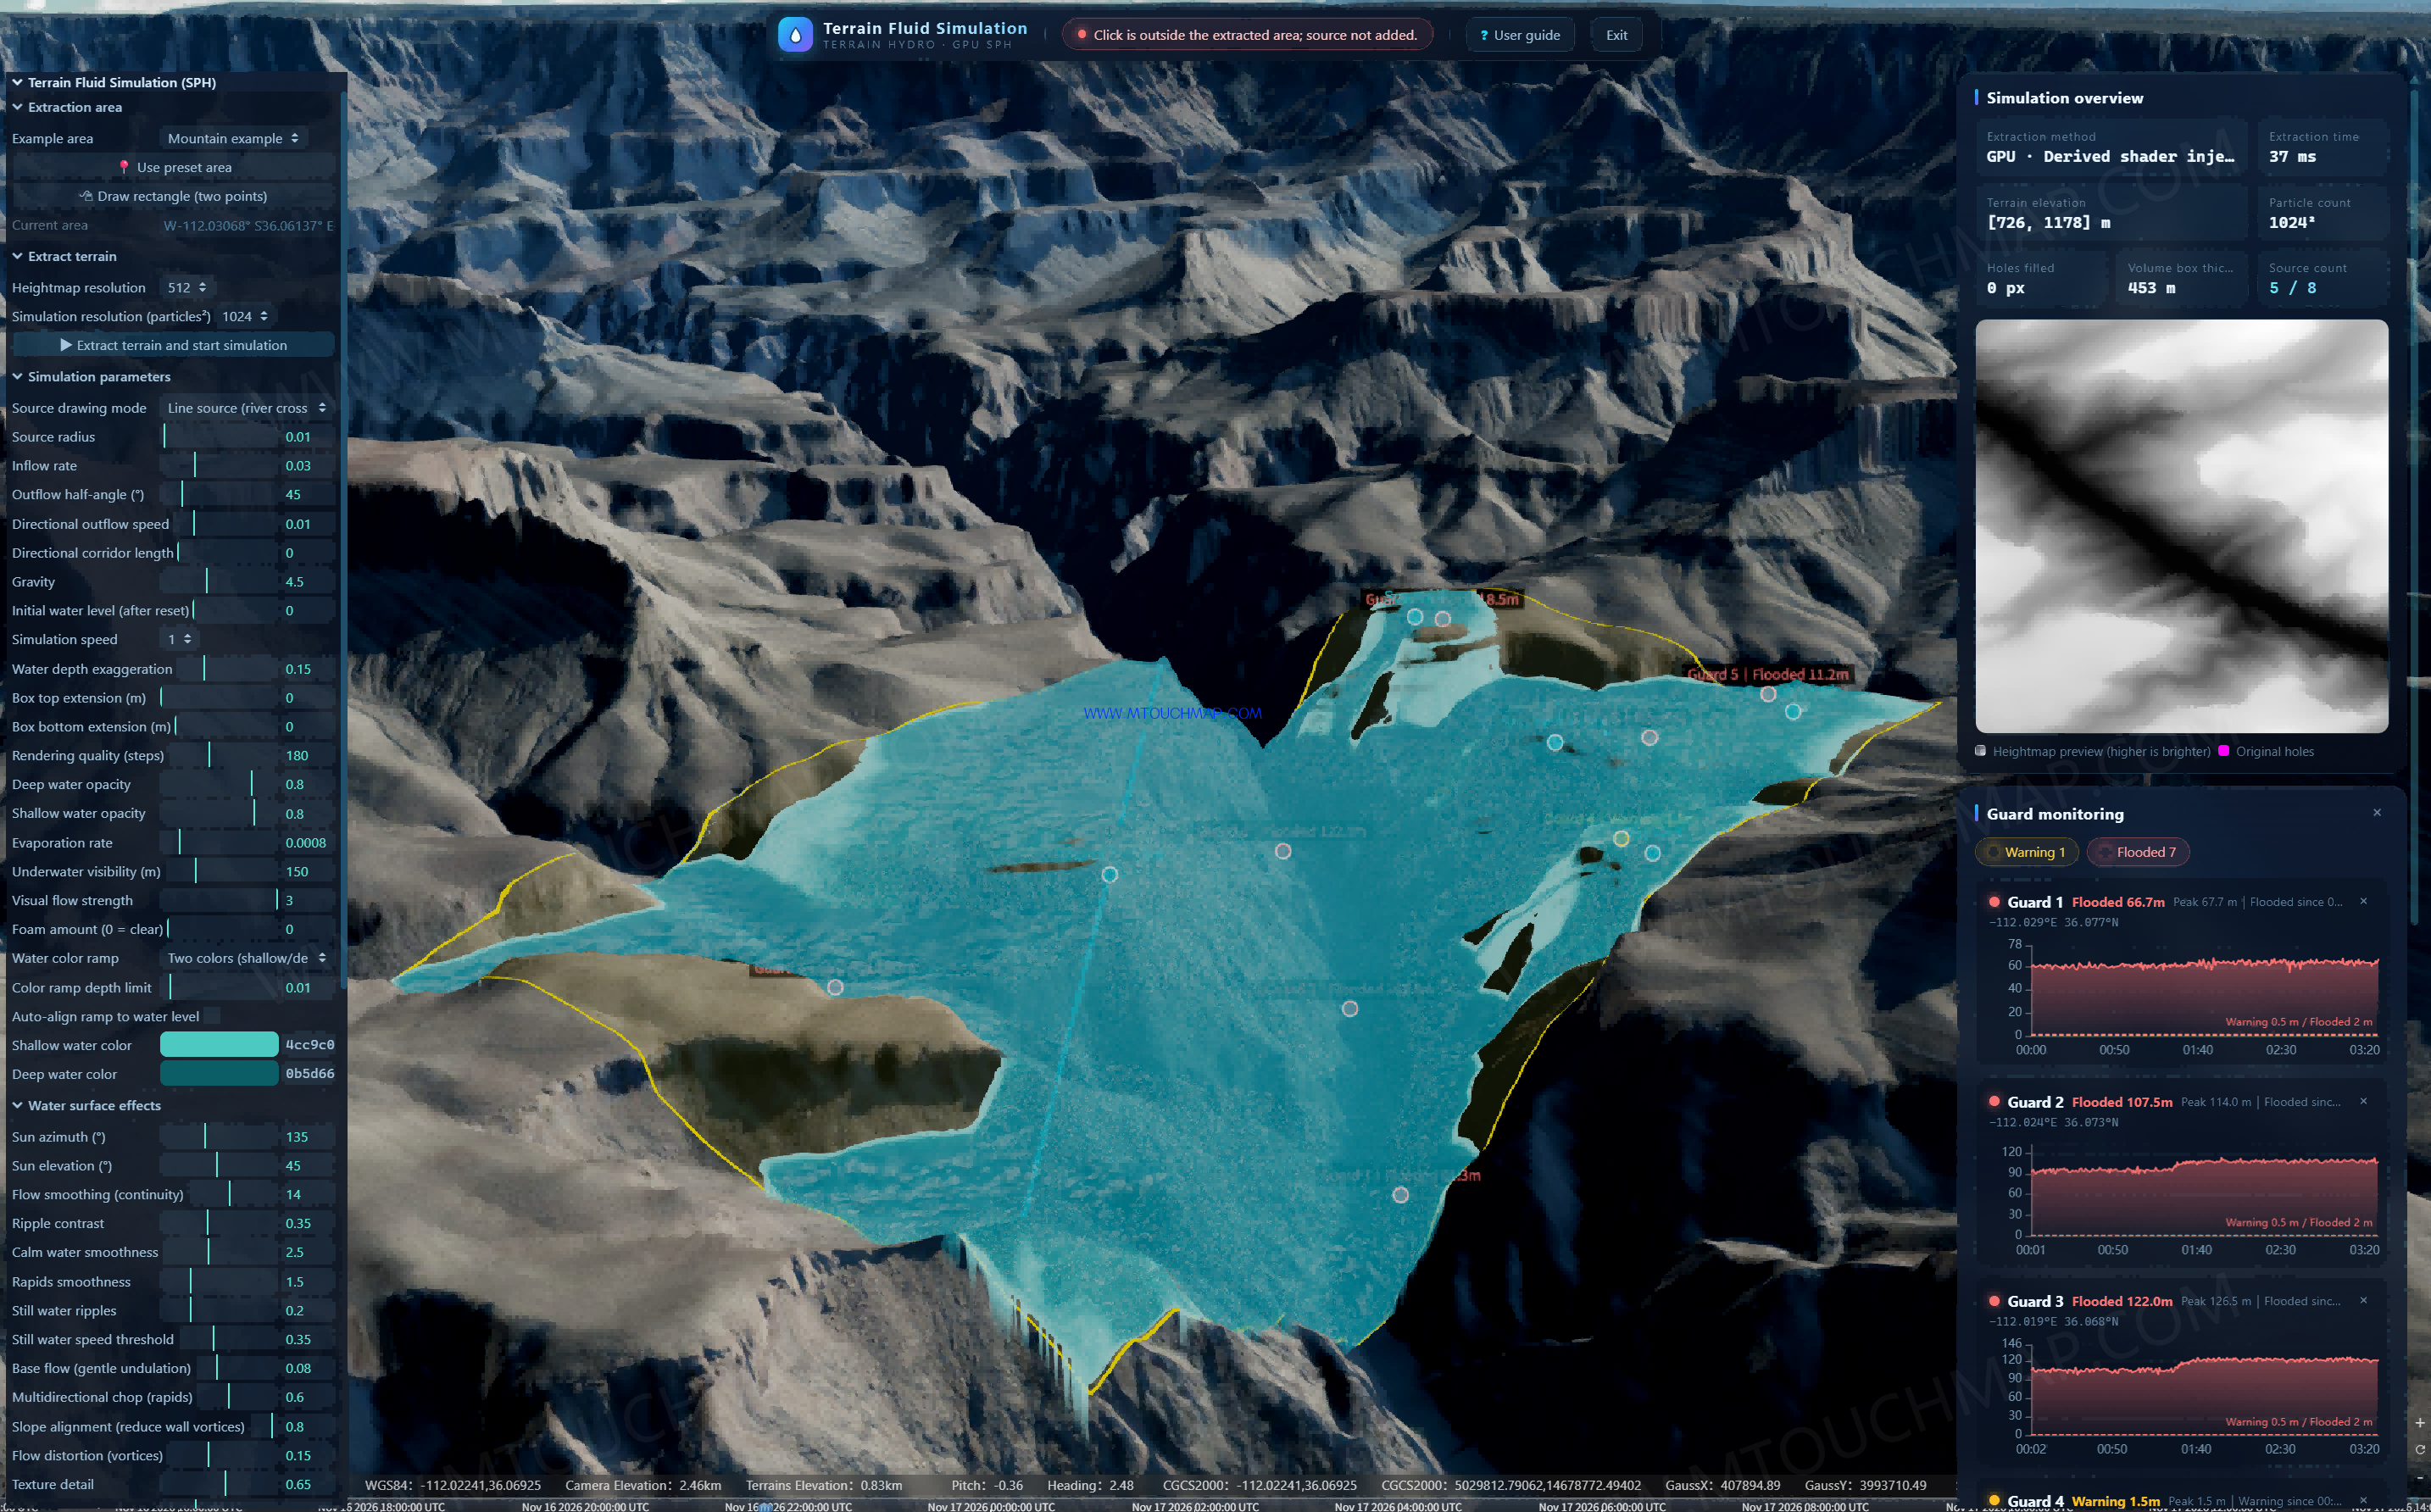
This demonstration uses the Grand Canyon in the United States as the base map. Terrain elevation ranges from 726 to 1,178 meters, with a relief of 452 meters. Cliffs are steep and valleys are deeply incised. Powered by GPU acceleration, the system completes terrain extraction in 37 milliseconds, with 1024² particle-level fluid simulation and a vertical computation thickness of 453 meters, fully covering the three-dimensional canyon space.
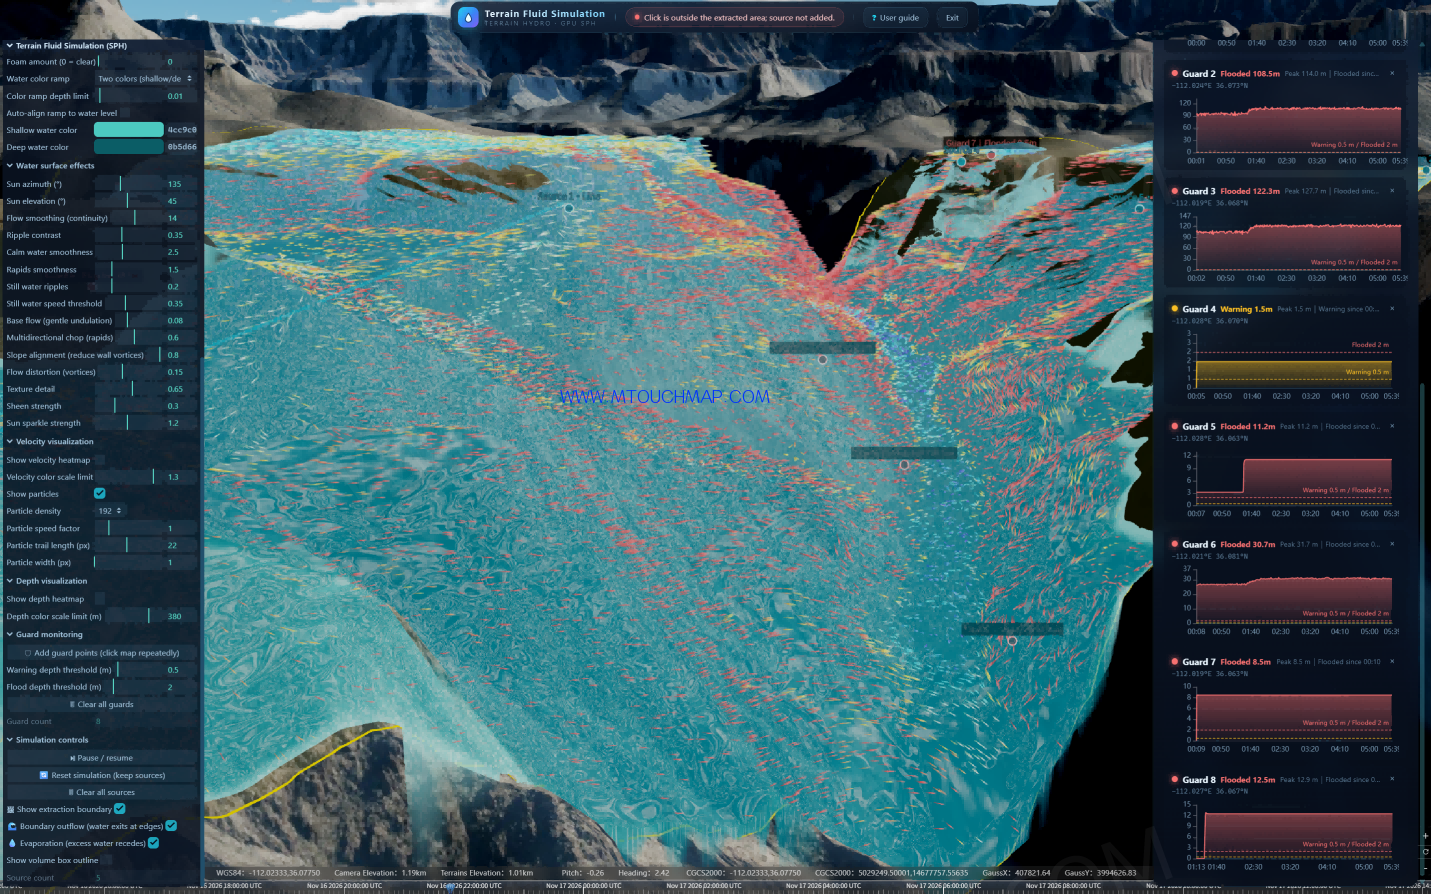
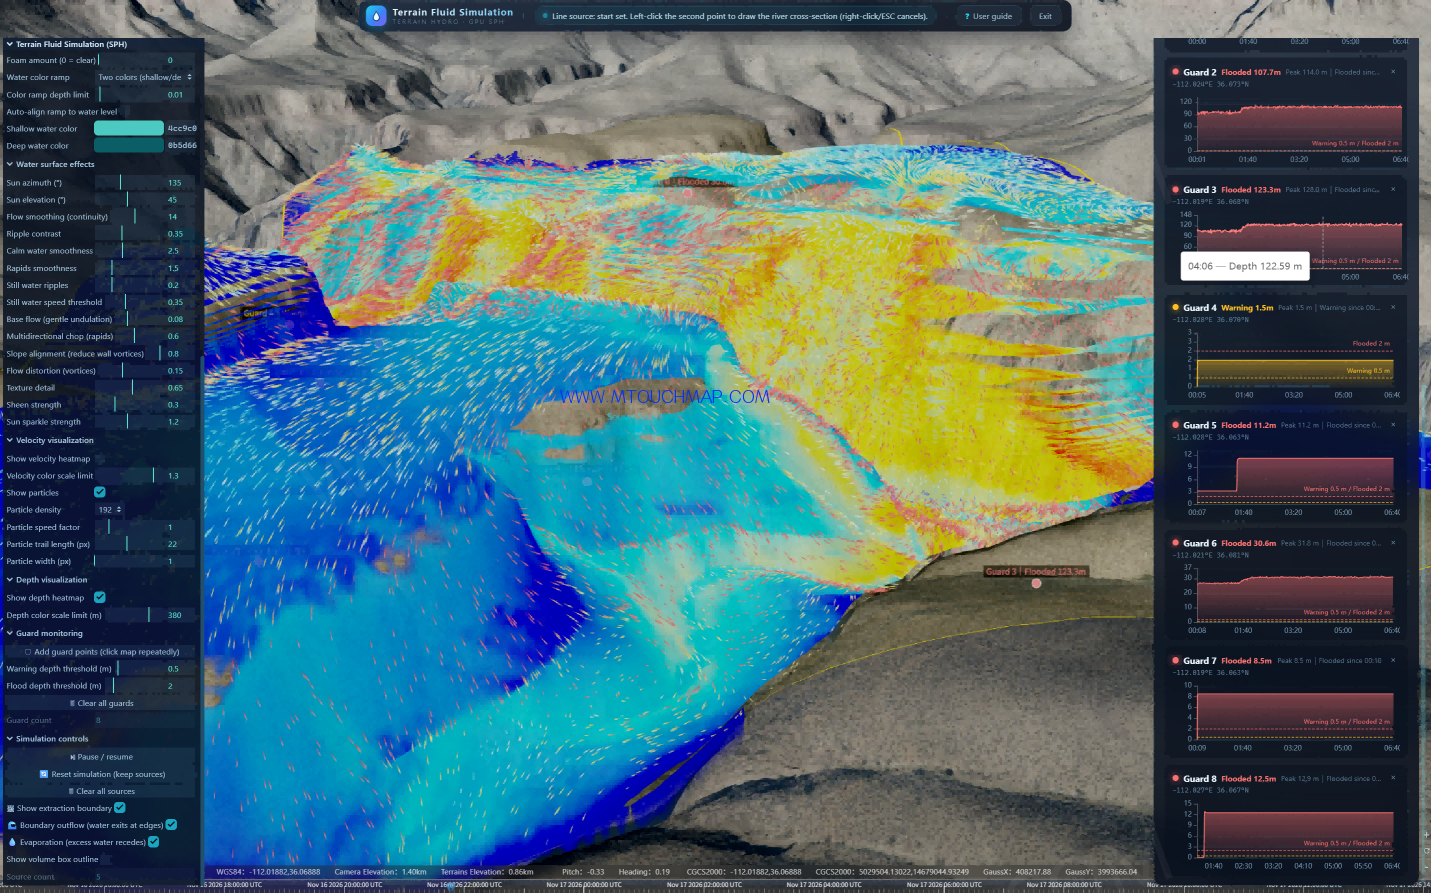
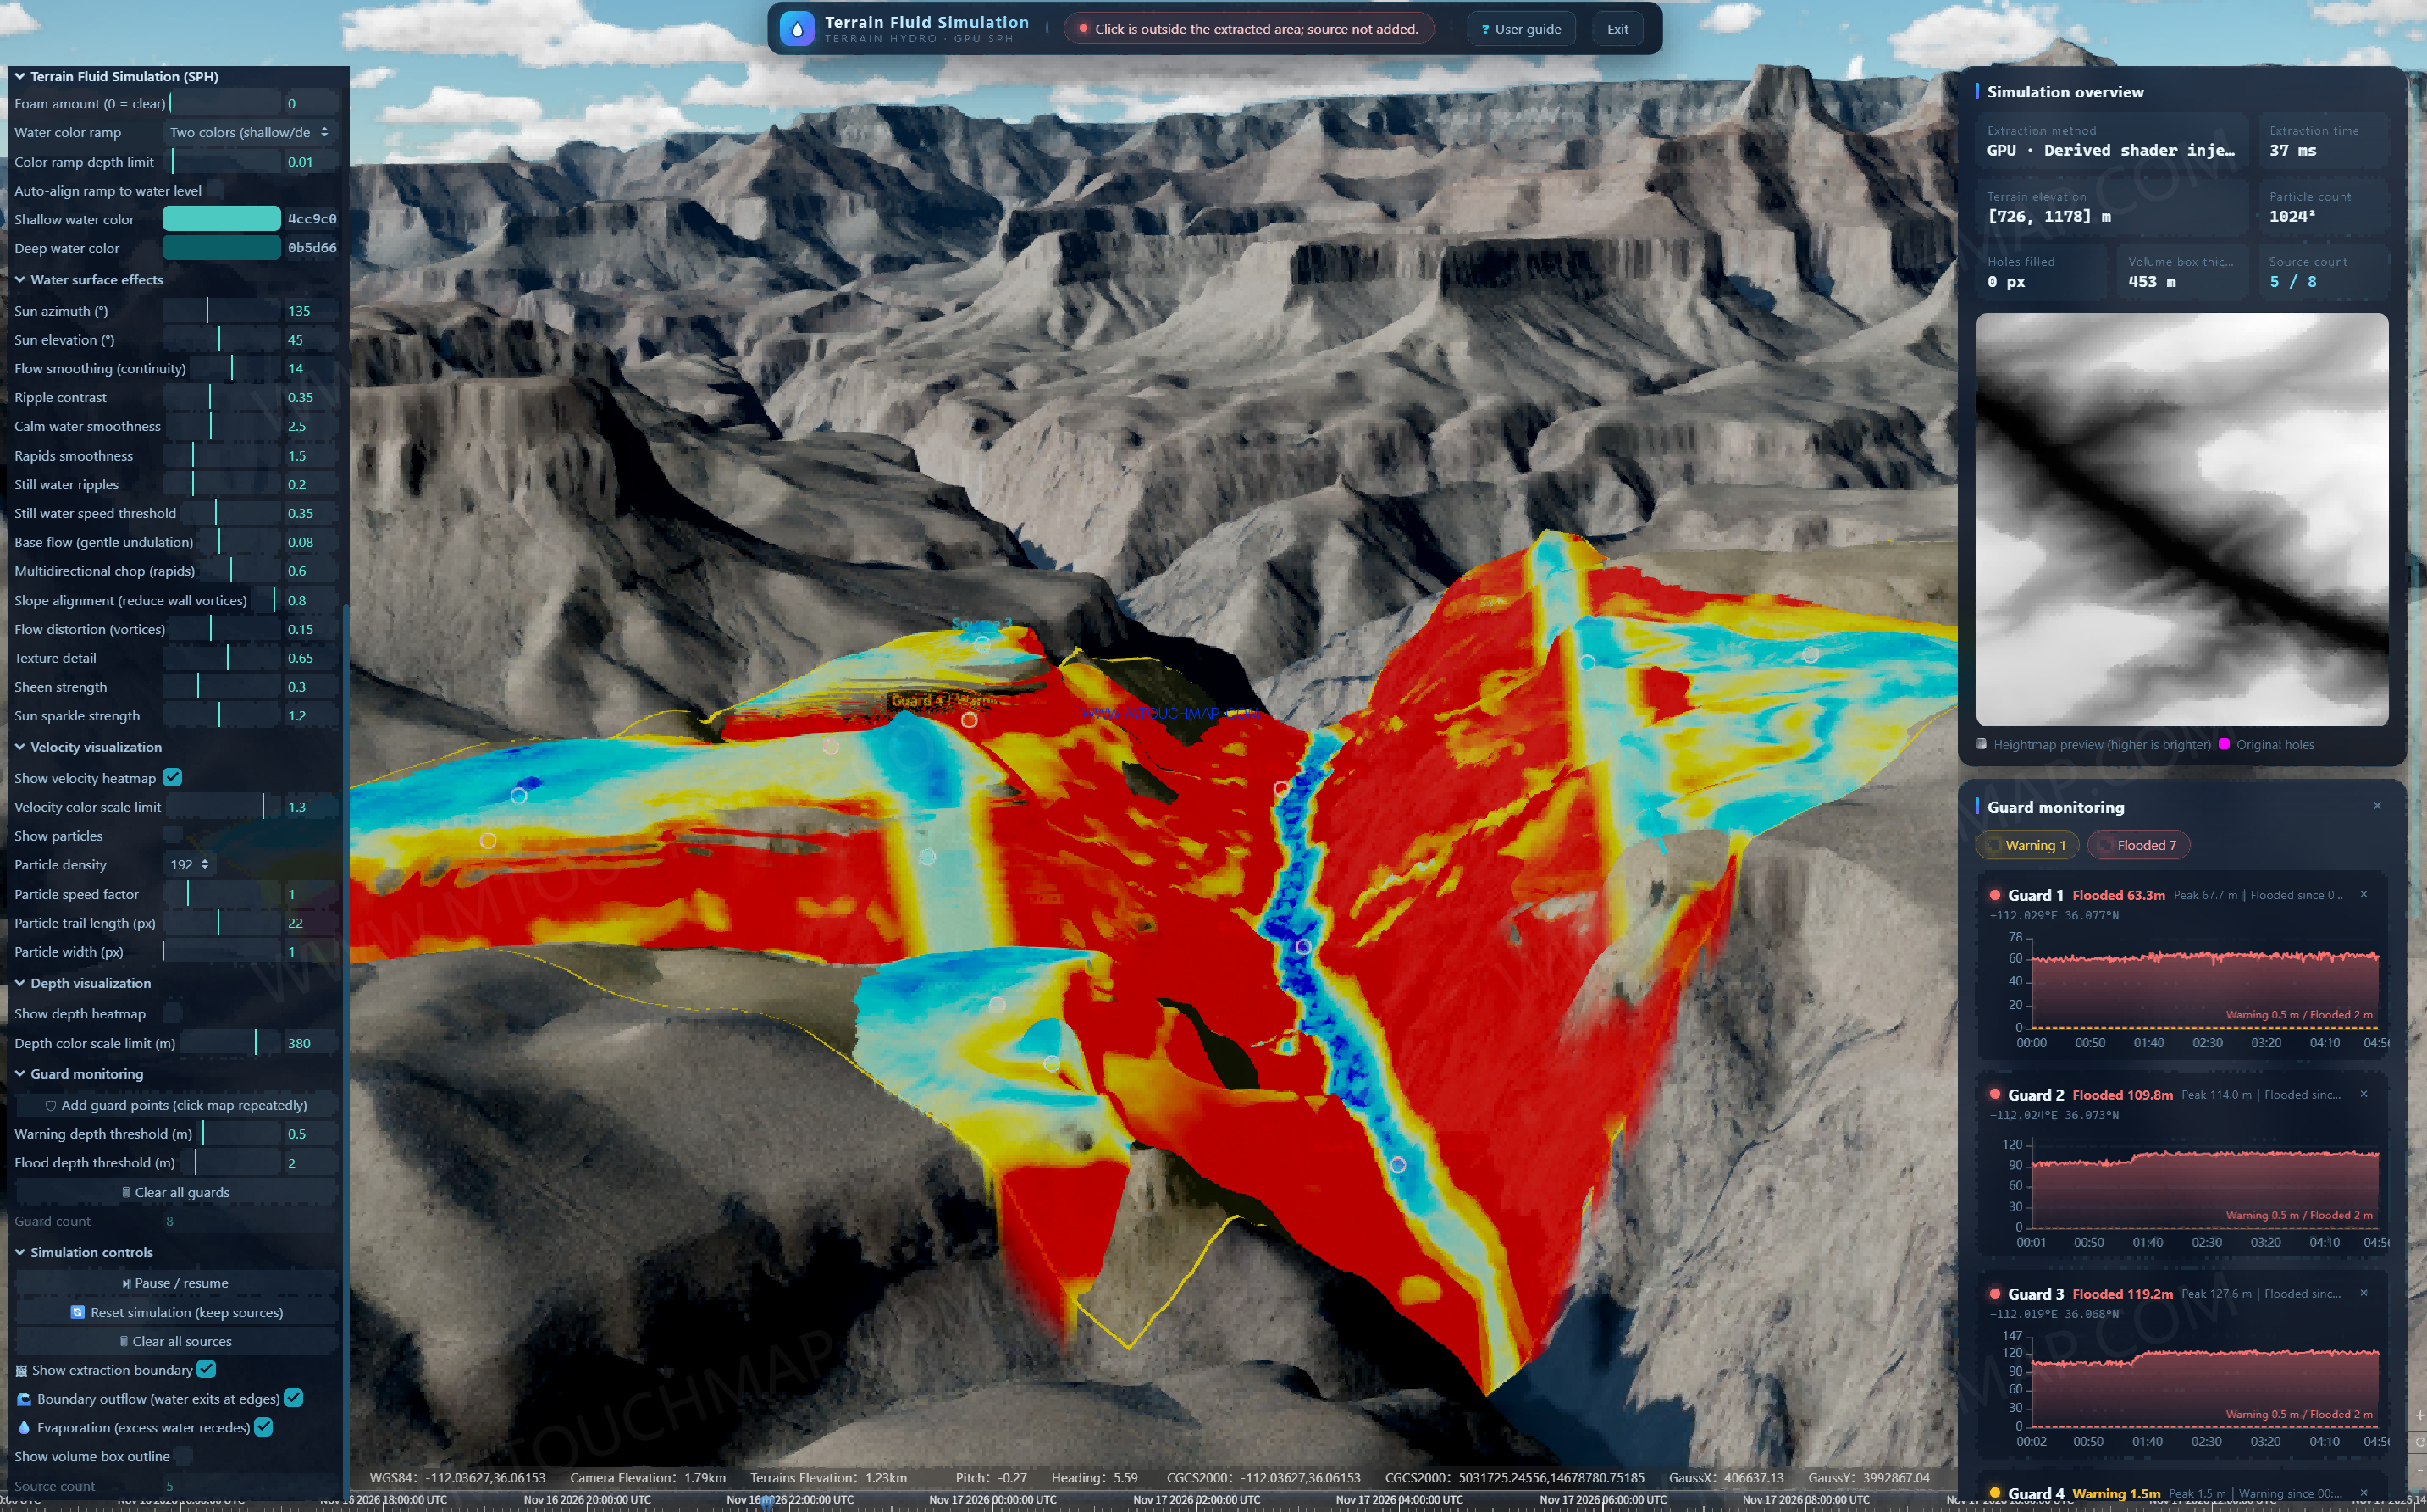
Five water sources are deployed in the deduction, including line, area, and point sources, simulating simultaneous multi-source inflow from the upstream converging into the main channel. Based on GPU SPH simulation, water converges, collides, and accelerates in the real canyon. Overlaying the velocity heatmap, depth heatmap, and 192 density-path particle tracking, floodwater can be seen rising, swirling, and stacking rapidly in the V-shaped narrow valley. Red indicates dangerous fast-flow zones, blue indicates deep inundation zones, and both velocity and depth peak in the narrow reaches.
Early warning is the ultimate goal. Along roads, bridges, and other key locations, 8 Guard monitoring points are deployed, automatically generating confluence hydrographs and automatically recording peak water depth and inundation onset time. Guard 3 peaks at 128.0 meters, Guard 2 at 114.0 meters, and Guard 1 at 69.3 meters. Seven points are flooded and one point is at warning level, providing quantified evidence for scenic-area closure, road blockage, and personnel evacuation.
This demonstration fully rehearses the complete chain of “multi-source inflow — canyon convergence — rapid flood routing — deep-inundation early warning.” It is suitable for canyon flash-flood risk assessment, flood-control planning for scenic areas and transportation corridors, and flood emergency drills, truly achieving training through simulation and strengthening prevention through training.
Step 1: Select the Area and Extract the Terrain to Build the Base Map
Select the extraction area in the interface. The current Grand Canyon area is W-112.03068° 36.06137°E, Heightmap resolution 512, simulation resolution 1024. Click to extract. The system uses the GPU Derived shader method and completes the extraction in 37ms. Terrain elevation is [726, 1178]m, volume box thickness is 453m, holes filled is 0px, fully covering the 3D space of the deeply incised canyon. This step gives all subsequent water flow a real “container.”
Step 2: Deploy Water Sources and Set How the Water Comes In
The water source drawing mode uses Line source, Source radius 0.01, Inflow rate 0.03, Outflow half-angle 45°. A total of 5 water sources are deployed this time, with an upper limit of 8, including line, area, and point sources, simulating the extreme condition of simultaneous multi-source inflow from the upstream converging into the main channel. It is not a pasted inundation map — it really lets 5 streams come in at the same time.
Step 3: Start the Simulation and Let the Water Run by Itself
The simulation parameters are already set in the interface: Gravity 4.5, Simulation speed 1, water depth exaggeration 0.15, rendering quality 180 steps, Evaporation rate 0.0008, with Boundary outflow and Evaporation checked, so water can flow out from the boundary and excess water will recede. Based on GPU SPH terrain fluid simulation, water naturally converges, collides, accelerates, rises, swirls, and stacks in the real canyon.
Step 4: Dual Visualization to Judge Where It Is Most Dangerous
No guessing — just look at the map: the velocity heatmap, with a color scale limit of 1.3, where the red area is the dangerous fast-flow zone; the depth heatmap, with a color scale limit of 380m, where the blue area is the deep inundation zone. Overlaying 192 density-path particles, Particle trail 22px, the particles dynamically track along the flow direction. In the V-shaped narrow valley, floodwater rises, swirls, and stacks rapidly, and both velocity and depth reach their peaks in the narrow reaches, intuitively presenting the canyon characteristic that “rising water means disaster.”
Step 5: Guard Monitoring to Automatically Generate Early Warnings
This is the ultimate purpose of the deduction. In the 3D scene, along canyon roads, bridges, and other key locations, 8 Guard monitoring points can be arbitrarily deployed. In the interface, the warning threshold is Warning 0.5m and the inundation threshold is Flooded 2.0m. The system automatically monitors each point, generates an independent confluence hydrograph, and automatically records peak water depth and inundation onset time.
From the monitoring data on the right: Guard 3 peaks at 128.0m, Guard 2 at 114.0m, Guard 1 at 69.3m, Guard 6 at 31.8m, Guard 8 at 12.9m, Guard 5 at 11.2m, Guard 7 at 8.5m. Seven points reach inundation, and Guard 4 is only at warning level at 1.5m. Which point floods first and how deep it floods — all are quantified and traceable.
Step 6: Form Decisions to Serve Real-World Applications
This demonstration fully rehearses the complete chain of “multi-source inflow — canyon convergence — rapid flood routing — deep-inundation early warning” in the digital twin space. It is suitable for rainstorm flash-flood risk assessment in deeply incised canyons, flood-control planning for scenic areas and transportation arteries, and flood emergency drills, truly achieving “train through simulation, and strengthen prevention through training.